
It’s critical for nonprofit stakeholders to discover how to measure fundraising success, understanding that retention rates and acquisition costs aren’t just figures but stories of connection and investment. By tracking these insights, your nonprofit can hone its strategies for future campaigns.
Today, we’ll cover:
- Understanding Fundraising Metrics
- Key Metrics for Fundraising Success
- It’s Time to Use Fundraising Metrics in Your Nonprofit for Success
Understanding Fundraising Metrics
Fundraising metrics are vital tools for nonprofits. They shine a light on the impact of fundraising efforts and guide strategic decisions. By measuring success through these numbers, organizations can understand what works and adjust their approaches accordingly.
What Are Nonprofit Fundraising Metrics?
The right KPIs—or key performance indicators—can tell you a lot about your nonprofit’s health. Think of them as your organization’s pulse check. These figures help track everything from average gift sizes to donor retention rates, painting a clear picture of where funds are coming from and how often donors give.
If you’re aiming to raise more with less effort, knowing these metrics is like having an inside scoop on which parts of your campaign need fine-tuning or major overhaul. You’ll be able to pinpoint exactly why certain campaigns thrived while others didn’t quite hit the mark.
The Role of Accurate Data in Measuring Success
Data accuracy isn’t just important—it’s non-negotiable when it comes to measuring fundraising success accurately. Precise data ensures that every decision made—from planning future campaigns to tailoring communications—is based on solid facts rather than guesswork or gut feelings.
Collecting accurate data helps identify winning strategies over time, so investing in reliable fundraising software capable of capturing nuanced details across various channels could make all the difference in hitting those targets consistently.
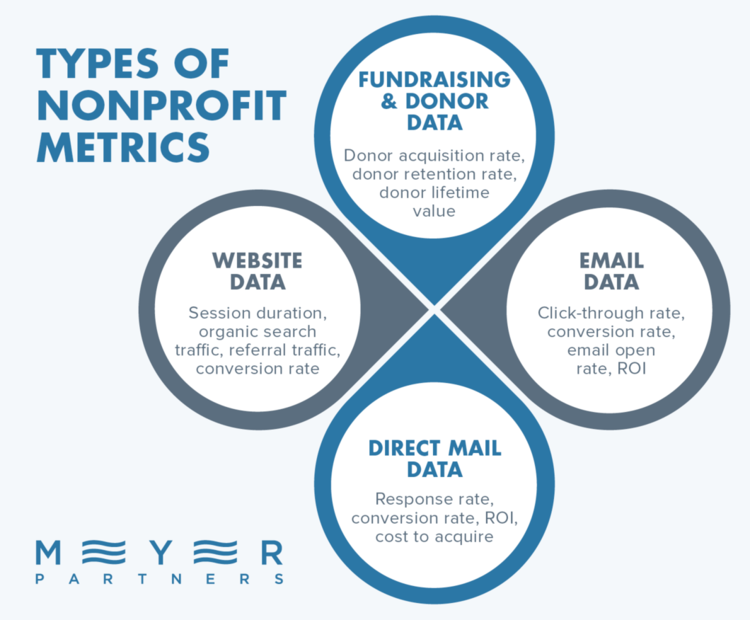
Key Metrics for Fundraising Success
Digging into essential KPIs is critical if you want a comprehensive understanding of both donor acquisition and retention along with overall ROI from your fundraising campaigns:
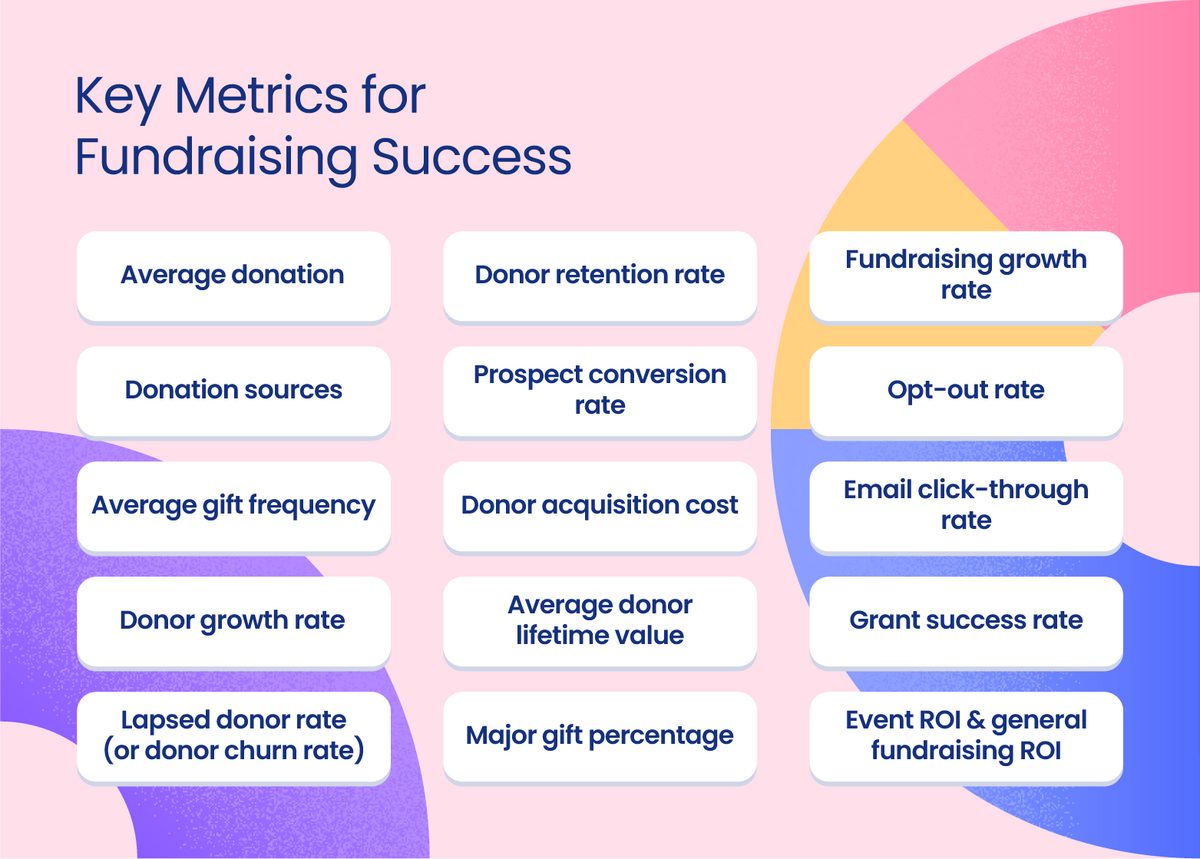
Average donation
The term “nonprofit average donation” typically refers to the average amount of money that an individual donor contributes to a nonprofit organization. This metric is calculated by dividing the total amount of donations received by the total number of individual donors.
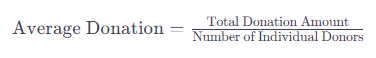
Monitoring the average donation size is vital for nonprofits as it provides insights into the giving behavior of their donors. It helps organizations understand the typical contribution they receive and can be used to set fundraising goals, tailor fundraising strategies, and assess the overall financial health of the organization.
Increasing the average donation size can be a goal for nonprofits looking to boost their fundraising impact and sustainability.
Donation sources
Where are your donations coming from? Is it events? Monthly donations? Perhaps major gift contributions from major donors?
Tracking metrics that break down the origination of each gift is hugely important so you can plan future fundraising efforts with the most effective sources in mind.
With this, you can also track how donations are made. Tracking online gift percentages versus cash or check donations will allow your organization to figure out if you need more POS systems at events, if you need more petty cash, etc. It’s just a good thing to track!
Average gift frequency
How often are donors giving? If the results are underwhelming, it could be because you’re not providing sufficient opportunities throughout the year for giving.
Donor growth rate
Growth isn’t just about adding—it’s also about holding onto what you’ve got. The donor growth rate tells us if our family of givers is expanding, which signals health and vitality within fundraising campaigns.
Lapsed donor rate or donor churn rate
Lapsed donors represent missed opportunities but also potential wins waiting around the corner if approached correctly; they’ve shown interest before after all.
Keeping tabs on the churn rate will alert you early enough so tailored re-engagement strategies can be put into action promptly.
Reviving interest among former contributors might require tweaking messaging tactics or introducing fresh engagement initiatives informed by demographic metrics, ensuring relevance resonates loud enough for another round of support.
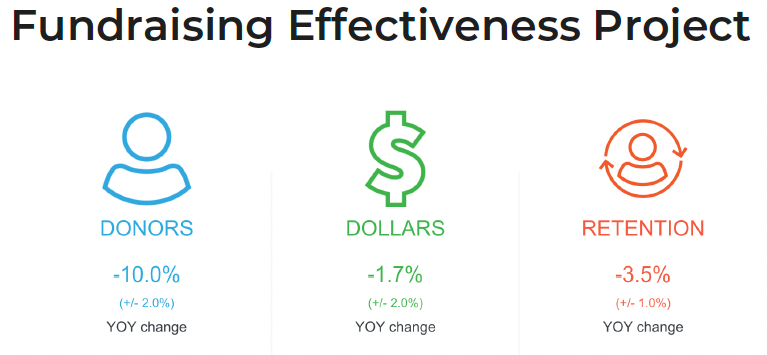
Donor retention rate
Donor retention rate focuses on your nonprofit’s ability to keep donors engaged over time. It tells you the percentage of last year’s supporters who are still contributing this year.
To improve donor retention, focus on creating meaningful connections with each gift giver. This might involve personalized thank-you notes or impact reports that show how donations make a difference.
Prospect conversion rate
The percentage of website visitors or potential donors who take the desired action (e.g., making a donation) is your prospect conversion rate.
Donor acquisition cost
Finding new donors is essential, but it can be pricey. Donor acquisition cost helps you determine the efficiency of your marketing efforts by revealing exactly how much spending goes into gaining one new supporter.
A lower cost per acquisition means more funds go directly toward your cause rather than overheads. You want to see this number go down while monitoring strategies that work best for attracting newcomers without breaking the bank.
Average donor lifetime value
Dive deep into the journey every donor takes with your organization by monitoring their lifespan—how long they stay active from their first gift to their last (hopefully far in the future.). A longer donor lifespan often correlates with greater total donation amounts due to repeated giving patterns over years—or even decades.
Increase lifespans by treating each contributor like part of an extended family whose involvement grows richer over time through consistent engagement and recognition programs tailored just for them because everyone likes feeling special now and then, right?
Major gift percentage
Tracking the number and value of major gifts (large donations from individuals, corporations, or foundations) is important because the more major donor relationships you have, the higher your fundraising numbers will be.
In fact, most successful nonprofits find that 80% of their donations come from only 20% of their donors. So, if your numbers aren’t quite there, you should be focusing on cultivating your major donor base.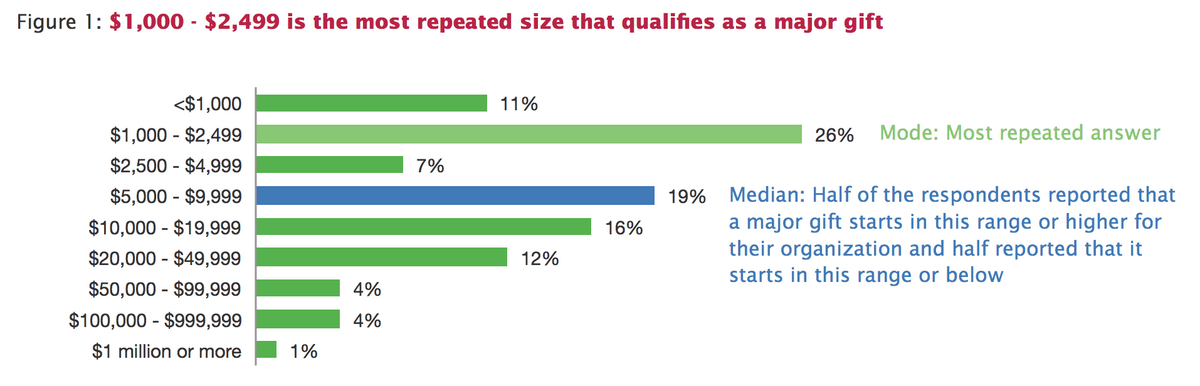
Fundraising growth rate
Average gift size growth suggests not only that donors are engaged but also willing to invest more into your cause over time. It’s a sign pointing towards strong relationships built by compelling storytelling or impactful results shared via social media and other platforms.
To keep this number growing, the focus should remain steadfastly on nurturing existing supporters while simultaneously seeking new ones through targeted outreach programs calibrated using insights gleaned from past performance metrics such as email open rates and click-through rates.
Opt-out rate
The nonprofit opt-out rate refers to more than just the email opt-out rate.
It refers to the percentage of individuals who choose to opt-out or unsubscribe from a nonprofit organization’s communications or mailing list. This metric is commonly associated with email marketing or other communication channels where individuals have the option to receive or not receive messages from the organization.
Here’s the formula for calculating the nonprofit opt-out rate:
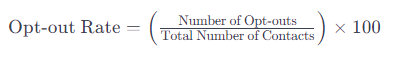
A low opt-out rate is generally desirable, as it indicates that a majority of the audience finds value in the organization’s communications and wishes to continue receiving them. On the other hand, a high opt-out rate may suggest that the content, frequency, or relevance of the communications needs improvement.
Nonprofits often use opt-out rates as a key performance indicator (KPI) to assess the effectiveness of their communication strategies. Monitoring and analyzing this metric can help organizations refine their messaging, segment their audience appropriately, and enhance the overall donor experience.
Additionally, nonprofits should ensure that their communications comply with relevant privacy regulations and provide easy and transparent mechanisms for individuals to opt-out if they choose to do so.
Email click-through rate
The email click-through rate (CTR) is an important metric for nonprofits because it provides insights into the effectiveness of their email marketing campaigns. The email CTR represents the percentage of email recipients who clicked on one or more links contained in an email.
For nonprofits, there are several reasons why monitoring and improving Email CTR is crucial, including:
- Measuring engagement
- CTA efficacy testing
- Segmentation and personalization testing
- Campaign optimization
- Benchmarking and goal-setting
Grant success rate
It’s not all about donors when it comes to fundraising. Grants are important, too, and you should be tracking how many you apply to against how many you’re actually receiving. This is your grant success rate.

If your grant success rate is low, why is that? Is it because your monthly donor base isn’t high enough? Perhaps your grant application copy isn’t powerful enough? With an eye on this number, you can look back introspectively and figure out how to maximize and improve your grant application efforts in the future.
Event ROI & general fundraising ROI
It’s not just about event attendance! Fundraising events and general fundraising return on investment (ROI) do wonders when checking if the money spent turns back enough dollars.
Calculating ROI helps nonprofits figure out where to allocate their resources best. It tells us if we should invest more in what’s working or improve strategies that aren’t hitting the mark. By keeping a close eye on this, we can make sure our investments are really paying off.
It’s Time to Use Fundraising Metrics in Your Nonprofit for Success
Tracking fundraising metrics is your roadmap to success. If you’re not tracking yet, it’s time to start tracking fundraising efforts with a tool like Stratly.
Not only will it help you engage with your donor and visualize success metrics, but it will also help you identify strategies for growth and greater impact.
Keep these lessons close: measure diligently, engage personally, and spend wisely. With every step forward, use data as your compass—and watch as every dollar raised charts a more impactful course for your cause.
If you want an overview of reporting features to see how we can help with your fundraising metrics and tracking, click here to book your free demo of Stratly.